What better time than at the start of a decade to nail one’s colours to the mast and make some bold predictions. What follows is my forecast for renewable energy uptake in Australia for the next ten years, and what I think that means for the electricity sector as a whole.
This isn’t going to be a very sophisticated analysis, more just applying rates of change and multiplying them out to the end of the decade. I’m also going to work in capacities rather than any sort of fancy electricity market model. I’ll point out some outcomes of the capacity as we go through.
Start of 2020
As we wobble into the 2020s Australia’s electricity grid is definitely in transition, but we’ve got loads of work to do. Here’s the summary of the National Electricity Market, the NEM, which is just the east coast. For what it’s worth I think Western Australia will follow roughly the same route in the next decade, scaled proportionally.
| Generator type | Number of Facilities | Capacity (MW) |
| Coal | 16 (3 brown) | 23,049 (4,690) |
| Gas | 51 (8 reciprocating) (20 open-cycle) (11 combined-cycle) (2 steam) (10 coal-mine waste) | 10,400 |
| Distillate (diesel) | 19 (includes the 2 temporary installations in SA) | 1,379 |
| Bioenergy | 37 (6 biomass, mostly sugar cane bagasse) (31 biogas, mostly sewage methane) | 433 (246) (187) |
| Hydro | 59 | 7,712 |
| Wind | 69 (nice) | 6,887 |
| Solar | 49 | 3,327 |
In addition to the above, we have a lot of solar on houses and businesses that don’t participate in the market, but still reduce electricity use. APVI is the best source for solar data, which hasn’t been updated from September yet, where they have total solar capacity across Australia at 13.9GW. Take out 15% for WA and that’s about 11.9GW in the NEM.
Batteries are just starting to be added to the grid and they’re hard to get data on. Solar data is quite good because there’s a registration process for each system to get the subsidy. There’s no parallel process for batteries so we don’t know how many systems are installed behind electricity meters around the country.
There are 215MW of grid scale batteries across five installations, which probably has about 300MWh of storage behind it. The vast bulk of the cells included are lithium-ion which are typically 1-2 hour duration chemistry.
Distributed across houses and businesses are a bunch of battery installations. There’s no solid data on this, but chatting with industry people the number is probably about 70,000 installations at about 3kW/9kWh average.
Solar
Australians love solar, and I don’t think this will ever change, because the fundamentals driving the solar market won’t change. As unlikely as it sounds, I am forecasting constant growth in solar for the next ten years, and because of the power of compound interest, this leads to some staggering outcomes.
Why do Australians love solar? I’ve been involved in some decent sized surveys of solar and battery customers, and the results were slightly surprising for me. At residential scale, and I can’t link to this data, the top three reasons offered for wanting solar were:
- To save money
- To reduce our carbon footprint
- Because I hate my retailer
Solar on your rooftop is cost-effective against purchasing electricity from the grid, with paybacks available in the order of 5-years. There are two parts to this; the cost of solar, and the cost of grid power.

Solar keeps getting cheaper, and I don’t see any reason for that to change on average. Grid power is getting more expensive, and even if it was sitting still the constant reduction in solar prices means there are more locations that solar works. Something drastic would have to happen to the solar industry and Australian electricity prices to break that trend.
On the other two reasons, it will be a long time before the grid is cleaner than a home solar system, and who thinks 2020 is the year that electricity retailers will suddenly become nice businesses to deal with?
The fundamental drivers for solar are here to stay. So I’m extrapolating growth rates of previous years out to 2030.
APVI has great data on the solar market in Australia, including installations by month all the way back to 2001. I’ve analysed these numbers here, and summarised below.

This data goes all the way back to April 2001, 19 years of monthly data. In the 224 monthly records I have the *lowest* month to month growth was 0.86% (I’m ignoring September because the latest entry tends to get revised up as more paperwork comes in). Monthly data is a bit lumpy to take seriously, so I’ve calculated the annual growth rate in the table. The lowest ever annual growth was 17.5% back in 2016.
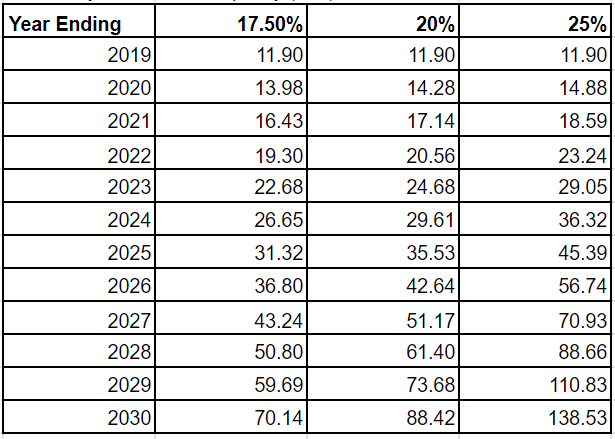
If solar continues growing at the lowest annual rate recorded in almost 20 years, we’ll be at 70GW of solar in 2030, and a couple of other potential growth rates there for comparison. I need to pick a number though and:
I’m forecasting 80GW of solar in the NEM by 2030.
This will mostly be behind the meter, with large, sporadic additions of grid solar. Big numbers I know.
Wind
We’re at about 6.9GW of wind now. I’m less familiar with the drivers behind wind deployment, but let’s apply the same brute force technique and see what comes out. Using Open-NEM generation data this time

The early years can be safely ignored, and there were some dark times when Abbott et al were fighting culture wars about wind turbines, but somewhere around 10-15% annual growth feels about right, with some high and low years. Scale that out for ten years and here’s what we get.

That is an implied capacity factor across the fleet of 28% which seems reasonable too. I don’t know as much about wind, and it’s more impacted by policy uncertainty than residential solar, so I’m taking the 10% number.
At the end of 2030 we’ll have almost 18GW of wind in the NEM, making about 44TWh/year.
Energy Storage
We’ll need a lot of storage of various types to smooth all this variable generation, and how this comes to market over the decade will make a big difference to our clean energy goals.
I wrote my engineering thesis on energy storage way back in 2007, a technology assessment of the best storage to match with a wind turbine in a small island grid. The answer was batteries. Back then, the best choice was sodium-sulphur, which sadly never really got commercialised because people were scared of storing sodium at 300 degrees C. Cowards
But that analysis included cost too. Excluding cost, lithium-ion has the best performance characteristics for grid support, mostly in cycling frequency and power quality. Since writing my thesis we’ve had the mobile computing revolution and subsequent decline in lithium battery prices, to the point that lithium is almost always the cheapest option. Some of the more exotic chemistries, like the Toshiba titanates can handle higher power, but they’ll be niche applications only. Lithium will eat >95% of the storage market.
How fast will it come? In my experience, residential storage is not being sold on economics alone. I know how many Powerwalls were sold at the start and I know what the economics on that unit was, and people clearly weren’t making purely economic decisions. They were buying batteries because they like them and like the independence they provide. Again, that driver isn’t going away.
The available and likely market for residential storage is existing solar customers. They have solar, it’s a sunk cost, they’re exporting power and seeing it in their bills, and want to fix that with a battery.
Residential batteries are sold and installed by the same people selling and installing solar. They use the same electricians, sales and service teams. Batteries are just a new product, introduced to a sales channel with existing capabilities. There will be little to stop battery sales ramping up as new models become available.
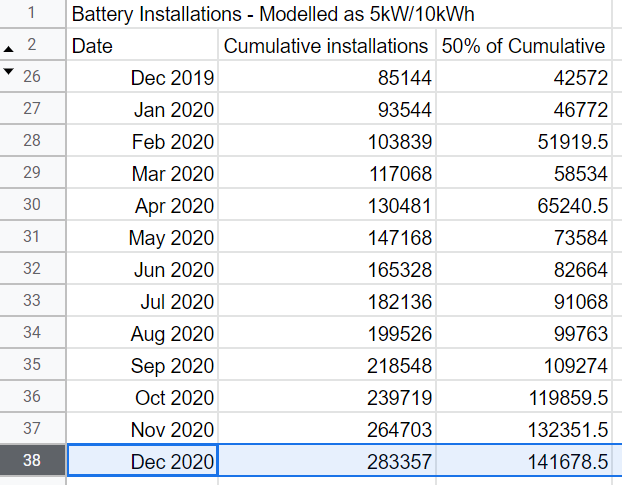
For these reasons, my model assumes that battery sales will follow the *installation* rate of solar, from whenever the equivalent period was. At the end of 2017 I would have guessed 10,000 battery installations in Australia, which puts us at about the start of 2008 for solar installations.

These systems will tend towards 5kW/10kWh, with some bigger commercial systems dragging up the average. I’ll model them all as 5kW/10kWh though.
Using solar installation rates as a proxy for battery installations, starting from the 2008 data, with batteries starting in 2018 seems a bit fast now that I’ve modelled it. 10,000 installations becomes 100,000 in two years! I’ve decided to halve that instead. So battery installations are modelled as the same installation rate as solar in Australia, starting in 2008, applied to the start of 2018, but divided by two as a fudge. Even that feels high, with 100,000 battery installations forecast for Australia in 2020. I’m sticking with it anyway.
Multiply that out and in 2029 we end up with 5.6GW of battery storage, able to deliver that for 2-hours, for a total of 11,265MWh.
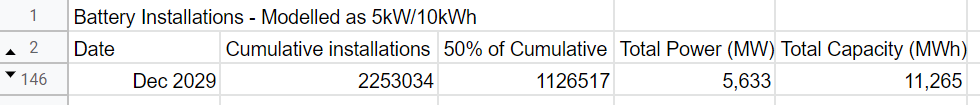

AEMO thinks we need 5GW by 2030, I think we’ll have that! Okay that number doesn’t feel too crazy.
Snowy 2.0
I haven’t included this in the model, because I honestly can’t see it being completed by 2030. It’s a big project! Lots of ways it can be delayed or made more expensive. I’ve also excluded it because I’m not sure what the impact will be. 2GW with a week of storage will probably be used to firm wind for some seasonal variation. Solar really drives daily charge-discharge cycles, which would be a bad use of Snowy.
I think the most interesting aspect of Snowy at the moment is the potential market power it might have. 2GW and a week of storage, flexing its muscles in a 5GW storage market is a significant degree of control. It will be very interesting to see how the government manages that.
What does all this mean?
If this much capacity does come on, what does that mean for the fossil fuels still in the grid?
I haven’t done a full time series model because it’s too hard and I don’t have the skills. But, I do have some rules of thumb I can apply to the grid with rigid modelling and crank out some outcomes.
Rule 1: Solar closes coal plants. This seems counter-intuitive to many because solar is intermittent; how does something intermittent close BASELOAD plant? By destroying its business case.
Once solar is installed, electricity comes out, that’s it. It doesn’t matter if the market is low, people aren’t home or there’s little demand, when the sun shines electricity comes out, and that peak output matches the sun’s peak output. That is, in the middle of every day. Solar pushes daytime demand (on the grid) down, lowering minimum grid demand. That minimum demand gives us an idea of what baseload plant can service. If the average daily minimum is 10GW, then there’s probably an economic case for about 10GW of coal (or steam-gas, like Torrens Island). Baseload plant does not want to turn off every day, or run at negative prices for 4 hours a day.
The minimum demand in the NEM is around 20GW, probably less, but I’ll leave it at 20GW to give the coalies a chance. The minimum demand served by coal is closer to 12GW. So I’m assuming that any coal above the minimum demand is uneconomic.
How much does solar lower minimum demand? Minimum demand is 20GW, with 14GW of solar in the NEM. I’ll assume that half of any additional solar lowers minimum demand. So if we ADD 6GW of solar, that will lower minimum demand by 3GW, and another 3GW of coal becomes uneconomic.

Again, the numbers are a bit crazy. That minimum demand isn’t really what I think the minimum grid demand is, more like a metric indicating the sort of demand we *could expect*. That’s relevant because baseload plant want regular output. If for say, 30% of days of the year they’re sure there’s zero demand, then that’s 30% of their possible generation days gone.
This is really just putting numbers to something I’ve believed for a while; coal-fired electricity will be uneconomic across the NEM by 2030. It probably won’t all be closed, but it will require special payments to remain open, either in electricity market distortions or straight-up government handouts.
I haven’t attributed wind here either, because its impact on daily minima is less predictable. Broadly, I think wind takes energy sales from coal and that could be argued using the generation data.

Black and brown coal are getting smaller over time, gas is fairly steady, wind and solar getting bigger.
A note on nuclear; we don’t have any in Australia, and I say we never will. Why? Cold hard economics. Nuclear is like an expensive coal plant. It uses broadly the same thermodynamic cycle, and is best deployed as a baseload generator, which means that any reduction in capacity factor impacts profits. There is no chance of a nuclear generator operating in Australia before 2030, and I think we’ll have 80GW of solar by then. Maybe it’s going to be less than that, but no one is going to bet $20b to find out in ten years if they were right about solar installation rates falling.
Rule 2: Batteries close gas. They’re solving the same problem, filling in the gaps between variable renewables. Difference is that the batteries will be filled with free electricity, while gas needs $300/MWh to cover their fuel costs. Because the fuel is expensive, gas is driven by operational costs, not paying down capital. So they don’t run much, in the order of 10% capacity factor, waiting for the right market conditions to generate.

Gas in the NEM is fairly stable over time, wobbling around 19TWh for the last 14 years. I’ll assume their potential market is 20TWh and work backwards from there.
Most batteries will be deployed shifting solar into the evening. Houses that showed no demand or export during the day with solar without a battery, will move to zero demand during the day, export in the afternoon once the battery is full, then the battery covers the evening peak until it runs out. This ramp is typically covered by gas, illustrated by this grab from Queensland yesterday:

Moving left to right along the graph, solar is pumping at 1500, then tails off to zero by 1930. Combined-cycle gas is rising from 1500 as solar declines, then the open-cycle rises once solar is gone. Coincidentally, this is the time that prices spiked, shown in the second axis.
Batteries will dampen the rise of both of those generators, and push the need for them later and later into the night. The degree to which solar over-supply is shifted into the evening will determine the future of gas generators.
The impact of batteries across the network is complex. Houses that have solar and are exporting now, will add a battery and reduce their export, and reduce their peak in the afternoon, but their solar output will stay the same. In other areas, the battery will be export limited during the day, so the battery will liberate additional kWh from existing generators. These are the most cost effective deployments at the moment, so for this model I’ll assume that the electricity charging the batteries is from curtailed solar.
This is just capacity, there’s an interaction between the amount of deployed capacity and the degree to which it is utilised. Lots of batteries will be very well utilised; fully charged during the day and fully discharged overnight. Others will be oversized and never fully charge or discharge each day. Others still will do nothing at all for days on end as an electrical trip or some other problem means the battery is doing nothing. 1GWh doesn’t mean the grid gets 1GWh of effective storage.
For this model I’ll assume 20% of the potential daily battery capacity gets utilised to reduce gas use. If there is 1GWh of batteries deployed then the GWh they can steal from gas is 1GWh x 365 days x 0.2. I modelled 20% and it was a bit grim, so added 50% as comparison.

Well that one didn’t go as I’d hoped, maybe the next decade is the one for batteries. As modelled, batteries reduce gas use by 5-10% by the end of the decade. Wind will take some gas too but I haven’t modelled that yet.
What will impact this?
Solar
I don’t think anything can stop residential solar, apart from making it illegal. The economics are a run-away freight train and we’re all a lot better on the train than trying to stop it. I’m reluctant to type it, but I don’t think removing the small-scale renewables subsidy will slow the train very much. I’d like to see it stay though, as it gives a lot more control over a distributed power system, and is probably cost-effective anyway. It could be tweaked a little to get more of what we want, like prioritising west-facing panels, or inverters with smart control or voltage response, but I’m fine with leaving the subsidy.
Technical limits on the grid might slow uptake a little, but in my experience residential solar customers aren’t doing the maths in great detail. Export limits just reduce the economic case, but don’t impact the other reasons people like solar, so they’ll keep buying it.
Many will argue that “solar eats its own lunch”, and this will limit uptake. This view holds that because all solar produces power at the same time, the value of the electricity in the market reduces as more solar is added.
This only applies to market-exposed solar, plants that are connected to the grid just to sell electricity into the national market. In Australia we have almost 10GW of solar behind meters now, none of which is exposed to the market. Exposing behind the meter solar to the market requires significant market reforms that have been talked about for a decade and seem no closer to coming. This will have limited impact in Australia.
Further, the Australian electricity network is very expensive, so making electricity on site and avoiding paying for shipping it through the electricity network will always have an advantage. I’ve seen sites in the last year where the cost of solar on site is less than the network component of their electricity supply. That is, the electricity could be provided for free, but paying to transmit it through the network is more expensive than installing solar on the property.
The networks could change their tariffs to make solar completely unattractive, but I think they’re reluctant to push that button just yet. The networks have seemed to me to be walking a bit of a tightrope with residential solar; it’s an existential threat, but if they fight against it the threat will get worse and people will leave the grid. In the last 12 months I’ve seen their views shift more to viewing solar as an opportunity to be worked with, rather than against.
Wind
Network inaction could significantly limit wind installation rates, as grid restrictions make it impossible to build new plants. At some point they need to start building transmission infrastructure to open up new generation regions, but this is held up by Commonwelth of Australian Government (COAG) meetings and the processes behind that. There’s some movement now, but it could be very slow.
Conclusion
This clearly isn’t a perfect method but I’m sticking with it. Here’s where I think we’ll be in 2030.

Solar will keep getting installed at the rates we’ve seen in the last decade. Wind will go in fits and starts, but there’s enough projects in the pipeline that I still think we’ll hit that rate on average. Batteries are new and the economics look good in coming years, but it’s to be seen how much people want to buy them and how the market rules respond to them.
Someone take a pdf of this and sticky tape it to the front of the internet. Here is my prediction for 2030 and I’m not changing it.
Here’s the spreadsheet I did the calculations in.
Thanks for reading this far and let me know what you think in the comments.
EB
